
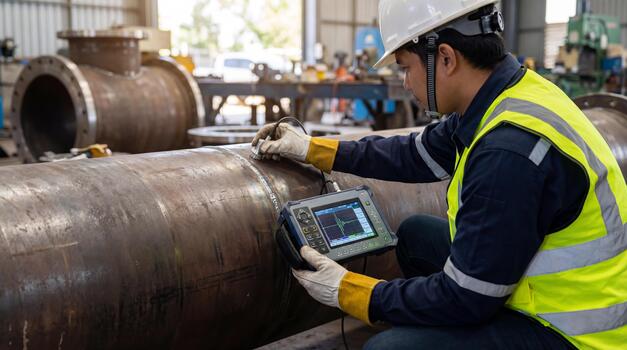
FFT vibration analysis explained is a cornerstone of modern condition monitoring and predictive maintenance. By transforming time-based vibration signals into the frequency domain, this technique allows maintenance professionals to pinpoint the exact sources of mechanical issues in rotating equipment, such as motors, pumps, and gearboxes. Understanding how to interpret the frequency spectrum is critical for diagnosing faults, improving reliability, and reducing unplanned downtime.
Whether you work in power generation, manufacturing, mining, or any industry reliant on machinery, mastering the basics of frequency spectrum analysis can help you detect problems early and optimize maintenance strategies. For those managing critical assets in energy production, you may also find value in exploring vibration analysis for power plants to see how these principles are applied in high-stakes environments.
Understanding the Basics of FFT and Vibration Analysis
At its core, vibration analysis involves measuring the oscillations of a machine or component over time. These vibrations are captured as time-domain signals, which can be complex and difficult to interpret directly. The Fast Fourier Transform (FFT) is a mathematical algorithm that converts these time-based signals into the frequency domain, revealing the individual frequencies that make up the vibration.
By examining the resulting frequency spectrum, analysts can identify specific patterns associated with common faults, such as imbalance, misalignment, bearing defects, or gear mesh issues. Each fault produces a unique signature in the frequency domain, making FFT an invaluable tool for troubleshooting and preventive maintenance.

How FFT Converts Vibration Data into the Frequency Domain
The process begins with a vibration sensor, such as an accelerometer, mounted on the machine. The sensor records the vibration as a voltage signal over time. This raw data is then fed into a data acquisition system or analyzer, which applies the FFT algorithm to break down the signal into its constituent frequencies.
The output is a spectrum plot, typically displaying amplitude (or velocity/acceleration) on the vertical axis and frequency (in Hertz) on the horizontal axis. Peaks in the spectrum correspond to dominant frequencies present in the vibration. By analyzing these peaks and their harmonics, technicians can trace them back to specific machine components or fault conditions.
Interpreting the Frequency Spectrum: Key Features and Fault Signatures
Reading the frequency spectrum is both an art and a science. Here are some of the most important features to look for when performing FFT vibration analysis:
- Running Speed (1X): The fundamental frequency at which the machine operates. A large peak here is normal, but excessive amplitude can indicate imbalance.
- Harmonics (2X, 3X, etc.): Multiples of the running speed. Prominent harmonics may suggest misalignment or looseness.
- Bearing Defect Frequencies: Each bearing has characteristic defect frequencies (BPFO, BPFI, BSF, FTF). Peaks at these frequencies can signal bearing wear or damage.
- Gear Mesh Frequency: The frequency at which gear teeth engage. Sidebands around this frequency often point to gear faults or wear.
- Sidebands: Groups of peaks spaced around a central frequency, often indicating modulation from faults like looseness or electrical issues.
By comparing the observed spectrum with known fault signatures, maintenance teams can quickly narrow down the root cause of abnormal vibrations.
Applications of FFT Vibration Analysis in Industry
The use of FFT for vibration diagnostics extends across many sectors. In manufacturing and process industries, it is essential for monitoring pumps, fans, and compressors. In mining, vibration analysis for mining equipment helps ensure the reliability of heavy machinery operating in harsh environments. Pharmaceutical and food processing plants also rely on these techniques to maintain compliance and uptime, as seen in vibration analysis for pharmaceutical plants and vibration analysis for food processing equipment.
Textile mills use similar methods to keep looms and spinning machines running smoothly, as detailed in vibration analysis for textile machinery. Across all these industries, FFT-based diagnostics help reduce maintenance costs, prevent catastrophic failures, and extend equipment life.
Best Practices for Effective Spectrum Analysis
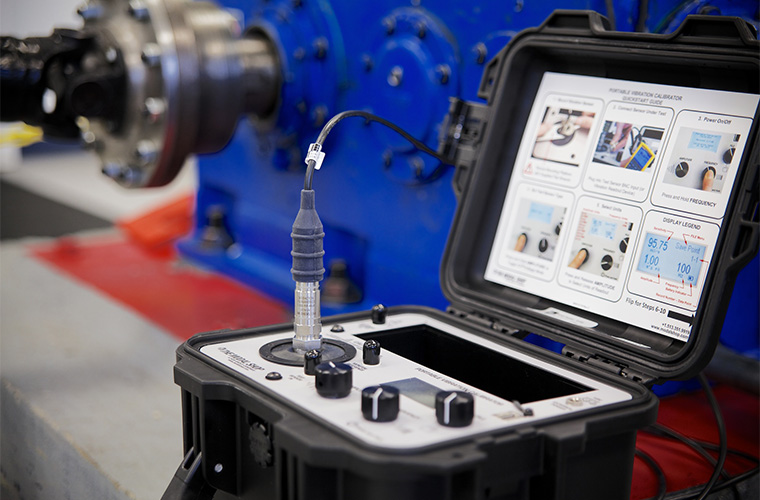
To get the most value from FFT vibration analysis, it’s important to follow some best practices:
- Sensor Placement: Position sensors as close as possible to the bearing or component of interest to maximize signal quality.
- Consistent Data Collection: Use the same measurement points and settings for trend analysis over time.
- Proper Frequency Range: Set the analyzer to capture all relevant frequencies, including those associated with bearings, gears, and structural resonances.
- Resolution: Higher resolution (more lines of resolution) provides finer detail in the spectrum, making it easier to distinguish closely spaced frequencies.
- Baseline Measurements: Establish baseline spectra for healthy machines to compare against future readings.
Regular training and experience are also key. Over time, analysts become adept at recognizing subtle patterns and distinguishing between benign and problematic signals.
Common Challenges and How to Overcome Them
While FFT-based vibration diagnostics are powerful, there are some common challenges:
- Noise and Interference: Electrical noise, structural resonance, or nearby machines can introduce artifacts in the spectrum. Use shielded cables and proper grounding to minimize interference.
- Aliasing: If the sampling rate is too low, higher frequencies can be misrepresented. Always follow the Nyquist criterion by sampling at least twice the highest frequency of interest.
- Data Overload: Large facilities can generate vast amounts of vibration data. Use automated software tools to flag anomalies and prioritize inspections.
For a deeper dive into advanced techniques and troubleshooting tips, consider reading this comprehensive overview of vibration analysis methods from industry experts.
FAQ: FFT and Frequency Spectrum in Vibration Diagnostics
What is the main advantage of using FFT in vibration analysis?
The primary benefit of FFT is its ability to break down complex vibration signals into individual frequency components. This makes it much easier to identify specific fault signatures, such as imbalance, misalignment, or bearing defects, enabling faster and more accurate diagnostics.
How often should vibration spectrum analysis be performed on industrial equipment?
The recommended frequency depends on the criticality of the asset and operating conditions. For essential machinery, monthly or even weekly measurements may be warranted. Less critical equipment can be monitored quarterly or semi-annually. Establishing a routine schedule helps detect changes early and prevent unexpected failures.
Can FFT-based vibration analysis detect all types of faults?
While FFT is highly effective for many mechanical faults, it may not capture issues that do not produce distinct frequency signatures, such as lubrication problems or certain types of structural cracks. Combining FFT with other condition monitoring techniques, like ultrasound or thermography, provides a more comprehensive assessment.
In summary, mastering the interpretation of the frequency spectrum through FFT is essential for anyone involved in machinery maintenance or reliability engineering. With the right tools, knowledge, and approach, you can leverage this technique to keep your equipment running smoothly and avoid costly downtime.