
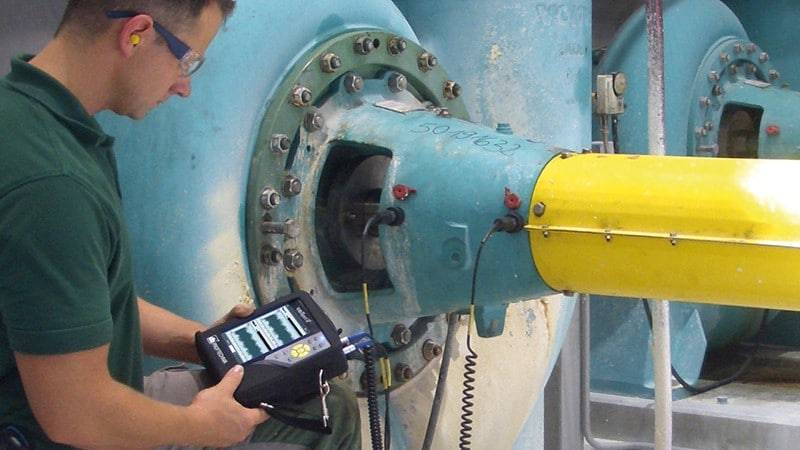
Understanding the health and performance of rotating machinery is crucial for industries that rely on equipment uptime and reliability. Among the many diagnostic tools available, time waveform analysis explained stands out as a direct and insightful method for interpreting vibration data. By examining how vibration signals change over time, maintenance teams can detect faults, pinpoint their causes, and make informed decisions to prevent costly failures.
This guide breaks down the essentials of time waveform analysis, clarifies what the data reveals about machinery condition, and shows how it fits into a broader vibration monitoring strategy. Whether you’re new to vibration diagnostics or looking to deepen your expertise, you’ll find practical insights here to help you get the most from your data.
For those interested in specialized applications, such as vibration analysis for power plants, time waveform interpretation is a foundational skill that supports proactive maintenance and asset reliability.
What Is Time Waveform Analysis?
At its core, time waveform analysis involves capturing the raw vibration signal from a machine and plotting it as amplitude versus time. This method provides a direct view of how the machine’s components are moving, allowing analysts to see patterns, impacts, and irregularities that may not be visible in frequency-based analyses alone.
Unlike the frequency spectrum, which breaks down the signal into its component frequencies, the time waveform preserves the original sequence of events. This makes it particularly valuable for diagnosing issues such as impacts, rubbing, looseness, and other transient phenomena.
Why Use Time Waveform Data?
While frequency analysis (such as FFT) is excellent for identifying recurring vibration sources, it can sometimes obscure the details of short-duration or non-repetitive events. Time waveform analysis explained in practical terms means you can:
- Detect impacts and shocks: Sudden spikes in the waveform often indicate bearing defects, gear tooth damage, or looseness.
- Identify modulation and periodicity: Changes in amplitude or repeating patterns can reveal misalignment, imbalance, or resonance.
- Visualize machine behavior: The shape and symmetry of the waveform can point to specific mechanical faults or operational issues.
By combining time waveform data with frequency analysis, you gain a more complete picture of machine condition and can diagnose complex problems with greater confidence.
How to Capture and Interpret Time Waveform Signals
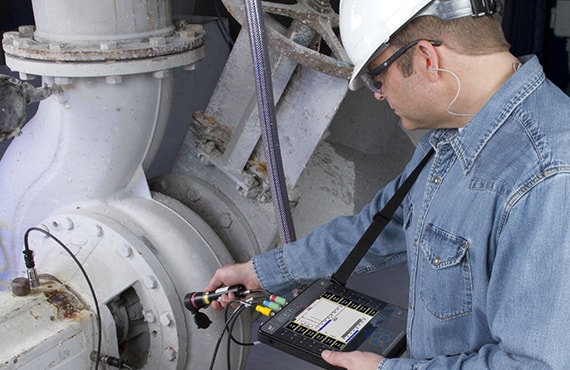
The process begins with placing vibration sensors (typically accelerometers) on critical machine points. The sensor records the vibration signal as a continuous stream of data points over a set period. This raw data is then displayed as a graph, with the x-axis representing time and the y-axis showing amplitude (displacement, velocity, or acceleration).
Key steps in effective time waveform analysis include:
- Proper sensor placement: Ensure sensors are mounted securely and in the correct orientation to capture the most relevant motion.
- Appropriate sampling rate: Use a high enough sampling rate to capture fast events without aliasing, but not so high as to create unnecessary data volume.
- Consistent measurement intervals: Collect data at regular intervals to track changes and trends over time.
- Careful interpretation: Look for repeating patterns, sudden spikes, or irregularities. Compare with baseline data and reference signals for your specific equipment type.
Common Faults Revealed by Time Waveform Analysis
Certain mechanical issues produce distinctive patterns in the time waveform. Recognizing these can help you quickly identify the root cause of abnormal vibration. Here are some typical examples:
- Bearing defects: Localized impacts or repetitive spikes often correspond to rolling element bearing faults. The interval between impacts can indicate the type of defect (inner race, outer race, or ball).
- Gearbox problems: Irregular pulses or modulation in the waveform may signal gear tooth damage, backlash, or misalignment.
- Looseness: Non-symmetrical waveforms with high amplitude and irregular shapes often point to loose bolts, mounts, or structural components.
- Imbalance and misalignment: Sinusoidal or periodic patterns are typical of imbalance, while misalignment can introduce additional harmonics or waveform distortion.
By learning to recognize these patterns, maintenance teams can act before minor issues escalate into major failures.
Integrating Time Waveform Analysis with Other Diagnostic Tools
While time waveform analysis explained in detail offers unique insights, it is most powerful when used alongside other diagnostic methods. Frequency spectrum analysis, envelope detection, and phase analysis each provide complementary information. For example, the frequency spectrum can identify the dominant vibration frequencies, while the time waveform shows how those vibrations manifest in real time.
Many modern vibration monitoring systems allow users to switch easily between time and frequency views, making it possible to correlate findings and confirm diagnoses. This integrated approach is essential for industries with critical assets, such as vibration analysis for mining equipment or pharmaceutical plants, where unplanned downtime can have significant consequences.
For a broader perspective on vibration diagnostics, you may find this complete guide to vibration analysis helpful for understanding the full range of available techniques.
Best Practices for Reliable Time Waveform Interpretation
To get the most from your time waveform data, consider these practical tips:
- Establish baselines: Record time waveform data from healthy machines to serve as reference points for future comparisons.
- Monitor trends: Track changes in waveform shape and amplitude over time to detect early signs of deterioration.
- Correlate with operating conditions: Note changes in load, speed, or process variables that may influence vibration behavior.
- Train your team: Invest in training so analysts can recognize subtle waveform features and avoid misinterpretation.
- Document findings: Keep detailed records of waveform patterns, associated faults, and corrective actions taken.
Following these practices helps ensure that your analysis is both accurate and actionable, supporting a proactive maintenance culture.
Applications Across Industries
Time waveform analysis is widely used in sectors where rotating equipment plays a vital role. Power generation, mining, pharmaceuticals, textiles, and food processing all benefit from early fault detection and improved reliability. For instance, vibration analysis for pharmaceutical plants helps maintain compliance and uptime, while in textiles, it keeps looms running efficiently.
No matter the industry, the ability to interpret time waveform data empowers maintenance teams to make smarter decisions and extend equipment life.
Frequently Asked Questions
What is the difference between time waveform and frequency spectrum analysis?
Time waveform analysis displays vibration amplitude as it changes over time, providing a direct view of machine movement and transient events. Frequency spectrum analysis, on the other hand, breaks the signal into its component frequencies, making it easier to identify recurring vibration sources. Both methods are complementary and often used together for comprehensive diagnostics.
How can I tell if a bearing is failing using time waveform data?
Bearing defects typically produce sharp, repetitive spikes in the time waveform. The spacing and amplitude of these impacts can indicate the type and severity of the fault. Comparing the waveform to baseline data and referencing bearing fault frequencies can help confirm the diagnosis.
Why is sensor placement important in time waveform analysis?
Correct sensor placement ensures that the most relevant vibration signals are captured. Improper mounting can introduce noise or miss critical motion, leading to inaccurate analysis. Always follow manufacturer guidelines for sensor orientation and attachment to get reliable data.
Can time waveform analysis be automated?
Many modern vibration monitoring systems offer automated data collection and preliminary analysis. However, expert interpretation is still essential for diagnosing complex faults and making informed maintenance decisions.
By mastering time waveform analysis and integrating it with other diagnostic tools, you can unlock deeper insights into your machinery’s health and drive more effective maintenance strategies across your organization.