
Understanding how to interpret vibration data is essential for engineers involved in predictive maintenance, machinery diagnostics, and reliability engineering. Vibration analysis provides critical insights into the health of rotating equipment, helping to identify faults before they lead to costly downtime or catastrophic failures. This guide breaks down the key principles, tools, and best practices for making sense of vibration measurements in an industrial context.
Whether you work in power generation, pharmaceuticals, mining, textiles, or food processing, the ability to analyze vibration signals can significantly improve asset reliability and operational efficiency. For those interested in industry-specific applications, our detailed resource on vibration analysis for power plants explores monitoring strategies for critical assets.
Why Vibration Analysis Matters in Engineering
Machines naturally vibrate during operation, but changes in vibration patterns often signal developing problems. By systematically collecting and interpreting vibration data, engineers can detect issues like imbalance, misalignment, looseness, and bearing defects early. This proactive approach minimizes unplanned outages, extends equipment life, and reduces maintenance costs.
Vibration analysis is particularly valuable in industries with high-value or mission-critical machinery. For example, in mining and pharmaceuticals, unexpected equipment failures can disrupt production and compromise safety or compliance. Regular monitoring and accurate interpretation of vibration signals are key to maintaining uptime and reliability.
Key Concepts in Vibration Measurement
Before diving into data interpretation, it’s important to understand the basic parameters used in vibration analysis:
- Amplitude: Indicates the severity of vibration, typically measured in millimeters per second (mm/s) or inches per second (ips).
- Frequency: Shows how often a vibration event occurs per second, measured in Hertz (Hz).
- Phase: Describes the timing relationship between vibration signals at different points on a machine.
- Waveform: The raw time-domain signal captured by sensors.
- Spectrum: The frequency-domain representation, usually obtained through a Fast Fourier Transform (FFT).
Collecting Reliable Vibration Data
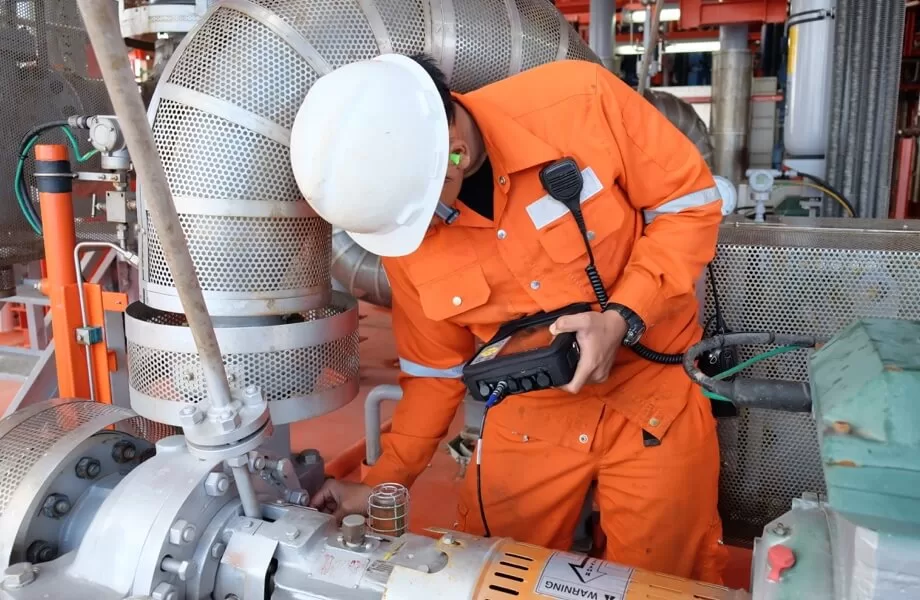
Accurate interpretation starts with high-quality data collection. Engineers should use calibrated accelerometers or velocity sensors, mounted securely on the machine’s bearing housings or other critical points. Consistent sensor placement and measurement conditions are vital for meaningful trend analysis.
Data should be collected under normal operating conditions, and it’s best to establish a baseline when equipment is known to be healthy. This baseline helps distinguish between normal vibration and signs of emerging faults.
How to Interpret Vibration Data: Step-by-Step Approach
Decoding vibration signals involves several steps. Here’s a practical workflow for engineers:
- Review Overall Vibration Levels: Compare current readings to baseline values and industry standards (such as ISO 10816). An increase in overall amplitude may indicate a developing problem.
- Analyze Frequency Spectrum: Use FFT to convert time-domain data into a frequency spectrum. Peaks at specific frequencies often point to particular fault types (e.g., 1x running speed for imbalance, 2x for misalignment).
- Identify Harmonics and Sidebands: Harmonics (multiples of a fundamental frequency) and sidebands (frequencies spaced around a main peak) can reveal complex issues like gear mesh faults or bearing defects.
- Evaluate Phase Relationships: Phase analysis helps confirm the source of vibration and distinguish between similar fault signatures.
- Trend Data Over Time: Monitoring changes in amplitude and frequency over weeks or months allows for early detection of deteriorating conditions.
Common Faults Detected Through Vibration Analysis
Interpreting vibration data enables engineers to pinpoint a variety of mechanical issues. Some of the most frequently identified problems include:
- Imbalance: Characterized by a dominant peak at the machine’s running speed (1x RPM).
- Misalignment: Often produces peaks at 2x or 3x running speed, sometimes accompanied by high axial vibration.
- Bearing Defects: Detected by high-frequency noise and specific fault frequencies related to bearing geometry.
- Looseness: Results in a broad spectrum with multiple harmonics and increased vibration at lower frequencies.
- Gear Mesh Issues: Identified by peaks at gear mesh frequencies and their sidebands.
For a deeper dive into industry-specific challenges, see our articles on vibration analysis for pharmaceutical plants and vibration analysis for mining equipment.
Best Practices for Reliable Interpretation
To ensure accurate and actionable insights from vibration monitoring, engineers should follow these best practices:
- Maintain Consistent Data Collection: Use the same sensor locations, measurement parameters, and operating conditions for each reading.
- Use Baselines and Historical Data: Compare current results to established baselines and historical trends to spot subtle changes.
- Correlate with Other Condition Data: Combine vibration analysis with temperature, lubrication, and process data for a comprehensive view.
- Train Personnel: Ensure staff are trained in both data collection and interpretation techniques.
- Leverage Automated Tools: Modern software can assist with pattern recognition and fault diagnosis, but human expertise remains essential for context and decision-making.
For those new to the subject, the beginner’s guide to predictive maintenance through vibration analysis offers a solid foundation.
Industry Applications and Case Examples
The principles of vibration interpretation apply across a wide range of sectors. In textile manufacturing, for instance, regular monitoring helps keep looms running smoothly and prevents costly stoppages. Food processing facilities use vibration data to ensure equipment safety and maintain uptime. Each industry may face unique challenges, but the fundamentals of signal analysis remain consistent.
Explore more about sector-specific strategies in our resources on vibration analysis for textile machinery and vibration analysis for food processing equipment.
FAQ: Vibration Data Interpretation for Engineers
What are the most important parameters to monitor in vibration analysis?
The key parameters are amplitude (severity of vibration), frequency (identifies the source of vibration), and phase (helps pinpoint the location and type of fault). Monitoring these over time enables early detection of developing issues.
How often should vibration data be collected?
The recommended frequency depends on equipment criticality and operating conditions. For critical assets, weekly or even continuous monitoring is ideal. Less critical machines may be checked monthly or quarterly, but consistency in measurement intervals is crucial for effective trending.
Can vibration analysis detect all types of machine faults?
While vibration monitoring is highly effective for detecting mechanical faults like imbalance, misalignment, and bearing defects, it may not identify all issues (such as electrical faults or process-related problems). Combining vibration analysis with other condition monitoring techniques provides the most comprehensive asset health assessment.
Conclusion
Mastering the art of how to interpret vibration data empowers engineers to make informed maintenance decisions, reduce downtime, and extend the life of critical machinery. By following best practices in data collection, analysis, and trending, professionals can transform raw signals into actionable insights that drive operational excellence.